
7.4 Illustrative Example Assessment of CHP Economic Viability
7.4.1 Simple Payback
The projected savings and required investment of a potential CHP project are shown in Figure 7.2. To simplify the analysis, only the major costs and savings are shown. They include energy costs electricity savings and fuel costs), non-fuel operations and maintenance costs, and installation costs. In an actual project evaluation, it is important to capture the savings or revenues from all value streams. Factors that affect savings include retail electric costs (demand and energy charges), ability to sell/export power, other utility costs (standby charges), fuel costs, CHP heat rate (fuel consumption), operations and maintenance costs, hours of operation, load factor, and value heat recovery.
Figure 7-2
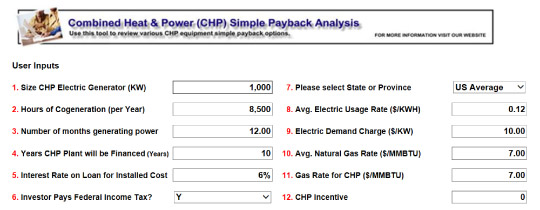
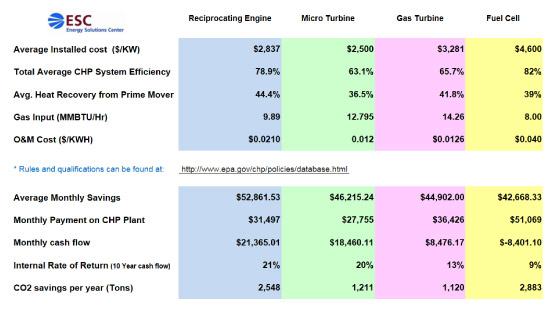
This tool provides a simple payback calculation for various CHP technologies based off the size and energy rates. The calculations use average pricing, efficiencies, & maintenance costs provided in the CHP Technology Catalogs available from the Combined Heat and Power partnership of the EPA.
7.4.2 Other Considerations
In many cases there are other potential value streams associated with a well-designed CHP that are difficult to quantify in a traditional economic assessment, but should be considered in the investment decision. They include but are not limited to:
- Improved reliability of energy service
- Independence from the grid in the event of an outage
- Improved productivity of core business processes
- Potential to shed load in the event of high demand during peak period
- Potential sale of ancillary services to utility or transmission operator
- Integration into a larger customer wide environmental compliance strategy
The value of these benefits depends on the characteristics of the customer, energy use patterns, electric utility, and
regulatory environment.