
CHP Market
An understanding of existing CHP sites provides insights with respect to project sizes, prime mover technologies, locations, site applications, and the role of natural gas. This section touches on the market potential for CHP. For a detailed state-level analysis of CHP potential, see the March 2016 DOE analysis titled ‘Combined Heat and Power (CHP) Technical Potential in the United States’, which can be found at:
NEW RELEASE — U.S. DOE ANALYSIS: COMBINED HEAT AND POWER (CHP) TECHNICAL POTENTIAL IN THE UNITED STATES
Much of the data in this section comes from this DOE study.
3.1 Current CHP Installations
CHP is an important electric generating resource in the United States. Currently, over 82.7GW of CHP capacity exists at over 4,400 industrial and commercial facilities across the country. This represents 8% of U.S. electricity generation capacity, however it represents over 12% of annual U.S. power generation, reflecting the longer operating hours of CHP systems as compared to conventional forms of generation.
CHP systems are installed in every state, however there are significant regional differences in the distribution of CHP sites and capacity. Some states have adopted policies that encourage CHP growth, most notably California, New York and Connecticut, which offer financial and other incentives to CHP projects. Other regional variations come from electricity price variations, energy market structures, and industrial development. For example, chemicals and refining facilities are common in the Gulf Coast states and paper production in the Southeast. States with higher overall energy demand, more energy-intensive industry, and dense population centers with concentrated electricity and thermal energy demand naturally have the highest amounts of CHP capacity.
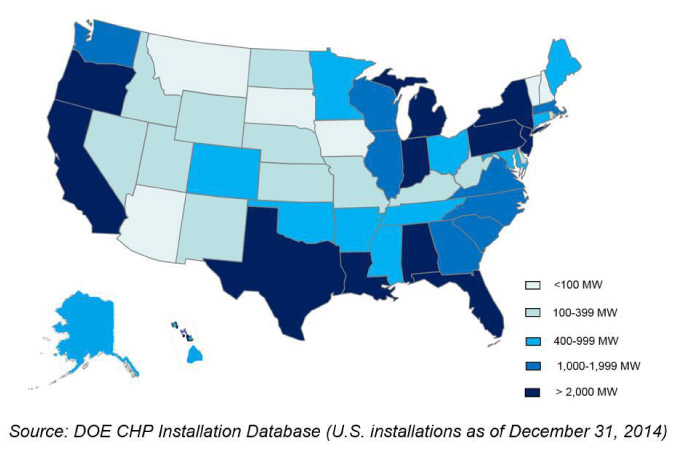
Figure 3-1 Existing CHP Capacity by State
CHP can be utilized in a variety of industrial facilities and commercial buildings with coincident power and thermal loads. Figure 3-2 presents a breakdown of CHP capacity by major market sector. The majority of existing CHP capacity in the United States is in the industrial sector and is concentrated in five major facility types: chemicals, refining, paper, food and metals manufacturing.
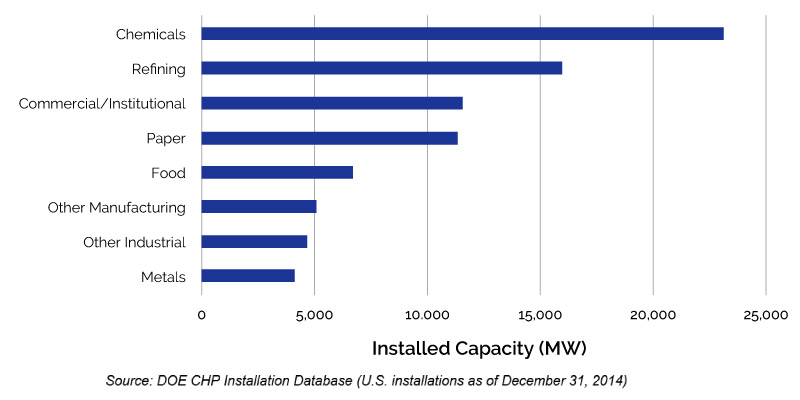
Figure 3-2: Existing CHP Capacity in the United States by Facility Type
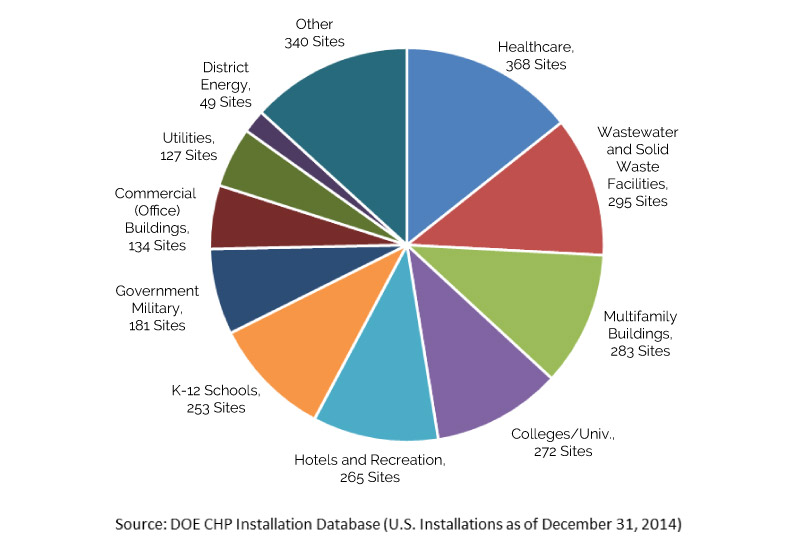
Figure 3-3 shows existing commercial CHP by business type.
3.2 Future Market Outlook
The technical potential is an estimation of market size constrained only by technological limits — the ability of CHP technologies to fit customer energy needs without regard to economic or market factors. Across all CHP categories, there is estimated to be more than 240GW of technical potential at over 291,000 sites within the U.S. table 3-1 represents the total CHP technical potential identified in the United States by application or business type, including on-site CHP at industrial and commercial facilities, export, waste heat to power applications or district energy systems that could integrate CHP.
Table 3-1: CHP Fuel Use by Sector
| Business Type | 500-500 kW | 0.5 - 1 MW | 1 - 5 MW | |||
|---|---|---|---|---|---|---|
| #Sites | Capacity (MW) | #Sites | Capacity (MW) | #Sites | Capacity (MW) | |
| On-site Industrial CHP | 34,502 | 6,281 | 6,069 | 4,341 | 7,424 | 15,567 |
| On-site Commercial CHP | 185,625 | 20,068 | 37,939 | 18,100 | 15,535 | 20,284 |
| On-site WHP CHP | 332 | 73 | 132 | 95 | 341 | 868 |
| Export Industrial CHP | na | 0 | na | 7 | na | 3,929 |
| Export District Energy CHP | 0 | 0 | 0 | 0 | 5 | 18 |
| Total | 220,459 | 26,422 | 44,140 | 22,543 | 23,305 | 40,66 |
| Business Type | 5 - 20 MW | >20 MW | Total Sites | Total Capacity (MW) | ||
|---|---|---|---|---|---|---|
| #Sites | Capacity (MW) | #Sites | Capacity (MW) | |||
| On-site Industrial CHP | 1,901 | 17,036 | 479 | 22.157 | 50,375 | 65,381 |
| On-site Commercial CHP | 1,084 | 9,452 | 174 | 8,026 | 240,358 | 75,930 |
| On-site WHP CHP | 204 | 2,003 | 96 | 4,585 | 1,105 | 7,624 |
| Export Industrial CHP | na | 11,535 | na | 65,578 | na | 81,048 |
| Export District Energy CHP | 8 | 75 | 51 | 10,567 | 64 | 10,660 |
| Total | 3,197 | 40,101 | 800 | 110,913 | 291,902 | 240,644 |
In contrast to the existing facilities with installed CHP, which are heavily concentrated at large industrial manufacturing facilities, a significant portion of the remaining technical potential for on-site CHP in the U.S. is located in commercial facilities. Figure 3-4 shows both existing CHP and estimated technical potential capacity for on-site CHP in the most predominant sectors.
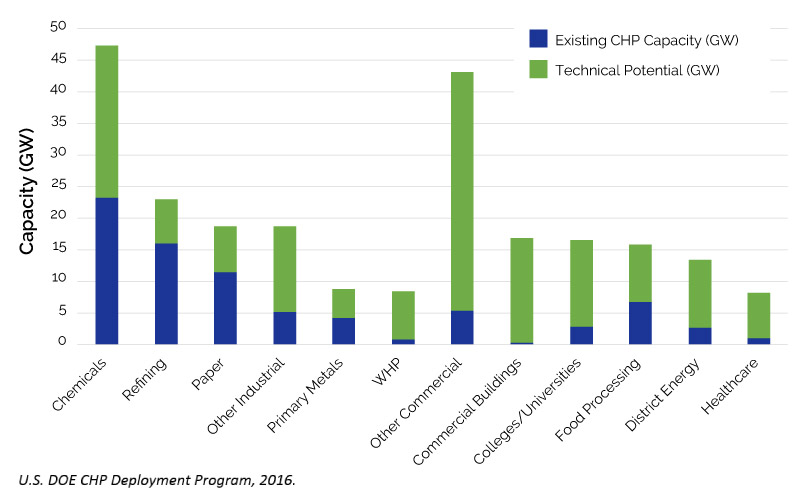
Figure 3-4: Existing CHP Compared to On-Site Technical Potential by Sector.